SONX
Turning a fragmented computational workflow into a clearer professional analysis product.
SONX brings street-network data collection, topology analysis, centrality analysis, resilience assessment, multi-area comparison, and publication-grade visualization into one cohesive, deterministic workflow.
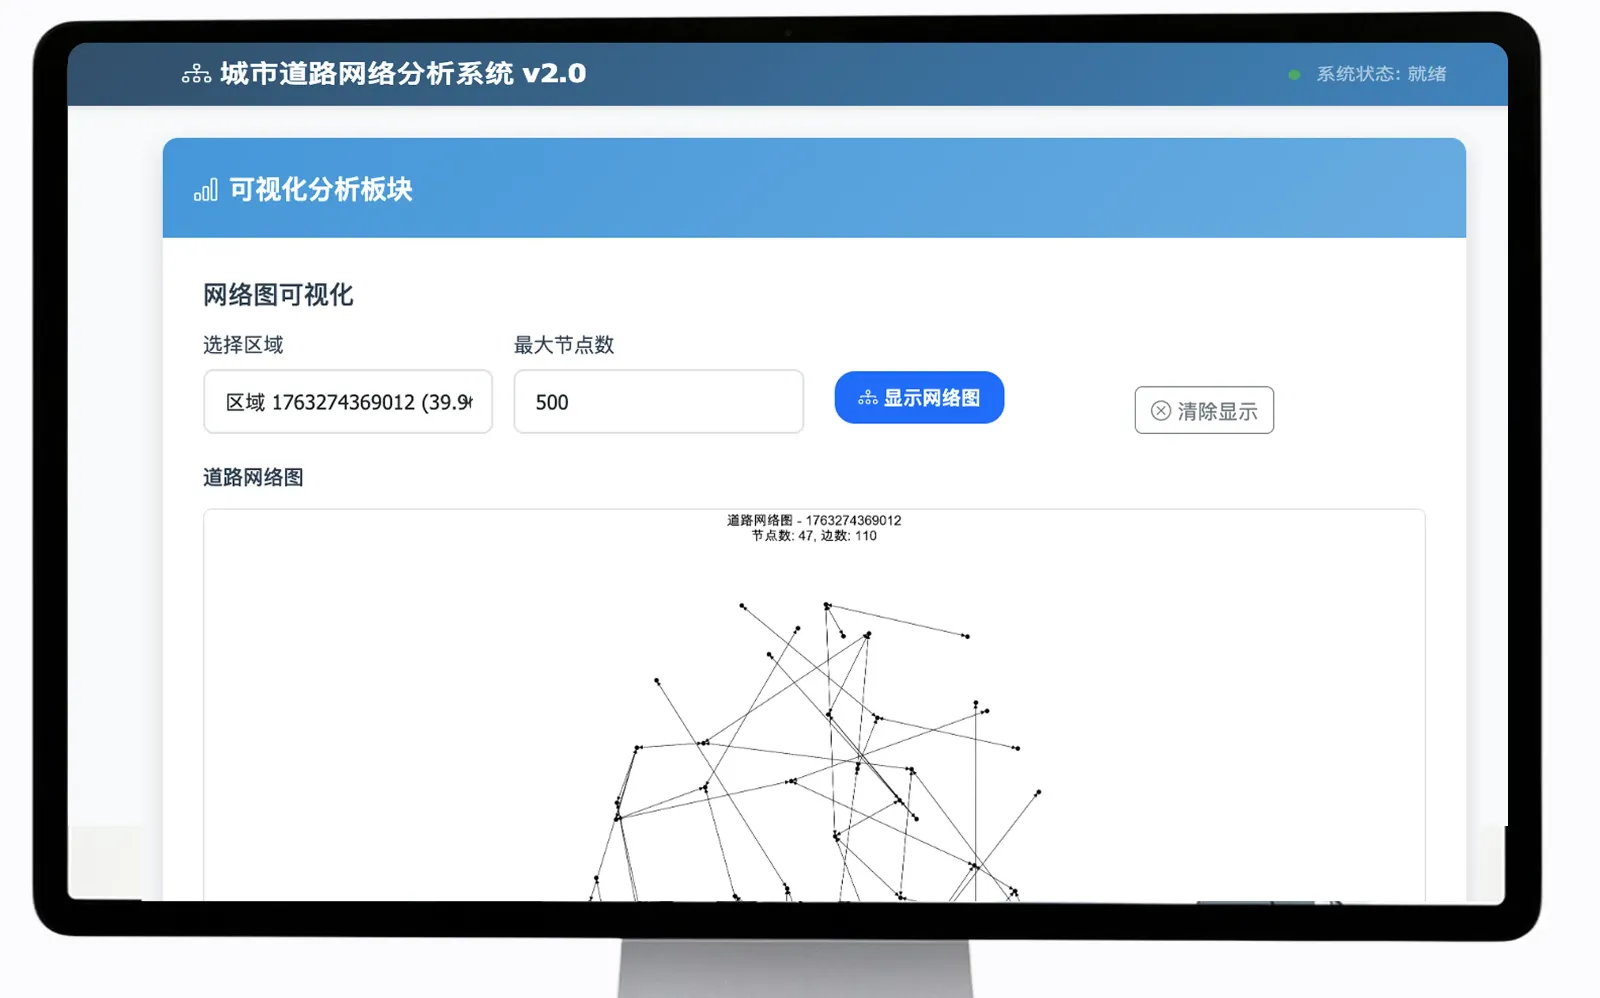
The analysis was possible. The workflow was not yet a product.
Street-network research often requires separate steps for acquiring data, preparing graphs, calculating indicators, comparing areas, generating visualizations, and organizing outputs. The technical methods exist, but the overall experience can remain fragmented and difficult to repeat.
Fragmented Script Ecosystem
Researchers juggle isolated Python scripts, Jupyter notebooks, QGIS spatial joins, and ad-hoc CSV exports. Every project variation introduced fragile directory dependencies and unversioned parameter shifts.
Opaque Computation States
Heavy graph algorithms like all-pairs shortest paths or large-radius betweenness centrality run for minutes without clear progress feedback, memory warnings, or isolated execution boundaries.
Cognitive Metric Overload
Mathematical engines dump dozens of raw topological scores (closeness, betweenness, circuity, edge density) without structuring them into communicative diagnostic tiers suitable for policy and planning.
Difficult Comparative Rigor
Contrasting multiple municipal districts or simulating pre/post disaster resilience required tedious manual data normalization, synchronized bounding box recalculations, and separate plot stitching.
"Translate a multi-step computational process into a professional product that makes analytical structure, progress, comparison, and results easier to understand."
Guided Pipeline
Replace brittle script chaining with a deterministic 8-step project lifecycle that validates state transitions between each phase.
Progressive Disclosure
Layer indicators from high-level resilience diagnostic scorecards down to raw edge-level graph matrices on demand.
Native Comparison
Make side-by-side benchmarking across divergent spatial bounding boxes a first-class citizen, synchronized in real time.
An 8-Stage End-to-End Analysis Workflow
The product formalizes the analytical method into eight sequential, reproducible stage gates. Each step enforces validation checks before feeding into subsequent algorithmic calculations.
Project Setup
Define study context, assign coordinate projection, and initialize metadata cache.
Network Data
Ingest Overpass geometries, clean topological dead-ends, and build primal graph.
Topology Analysis
Calculate node degree, link circuity, clustering coefficients, and alpha/beta connectivity.
Centrality Analysis
Compute multi-order betweenness, closeness, and eigenvector distribution.
Resilience Assessment
Simulate targeted node attack, random link failures, and giant component percolation.
Area Comparison
Align normalized spatial baselines and generate side-by-side indicator delta bars.
Visualization
Interactive thematic heatmaps, custom choropleths, and topological radar charting.
Export & Deliver
Package academic vector figures (SVG/PDF), GeoJSON layers, and analytical summary CSVs.
Key Design Choice Points
Editorial examination of foundational trade-offs resolved during product architecture. We balanced programmatic power against cognitive clarity.
Expose raw scripts - or design a guided analytical workflow?
The Situation: Scripts offer expert flexibility but require users to manage local environment dependencies, parameters, unlinked files, and visualization formats across disparate tools. Conversely, an overly simplified "black-box wizard" deprives researchers of rigorous parametric tuning.
The Strategic Decision: SONX organizes the work as a connected project workflow while preserving the analytical logic and algorithmic parameters behind each stage. Users advance through structured validation steps, with raw mathematical hyper-parameters (e.g., search radiuses, decay exponents, solver iterations) exposed in docked control drawers.
Show every metric at once - or build layers of interpretation?
The Situation: Network topology analysis can compute 30+ indicators simultaneously. Presenting all outputs in flat data tables makes the system technically complete but cognitively exhausting and difficult to translate into spatial insight.
The Strategic Decision: We formulated a three-tiered metric hierarchy. Macro diagnostic indicators (Resilience Index, Structural Efficiency) sit on top. Secondary dimensional clusters (Connectivity, Hierarchy, Circuity) provide middle-ground analysis, while raw mathematical graph primitives remain inspectable at the node and edge level.
Analyze one area in isolation - or make comparison a first-class workflow?
The Situation: Standard academic scripts treat each geographic area as an independent execution loop. Comparing how district A responds to disruption versus district B required manual copy-pasting of values into Excel sheets.
The Strategic Decision: Multi-area comparison is treated as a foundational product feature. Projects, indicators, and visual viewports are coordinated so users can benchmark up to 5 spatial zones side-by-side with synchronized zoom, normalized radar scales, and automatic delta calculation.
The Professional Analysis Experience
Eight coordinated workstation views structured for repeatability, diagnostic speed, and mathematical rigor.
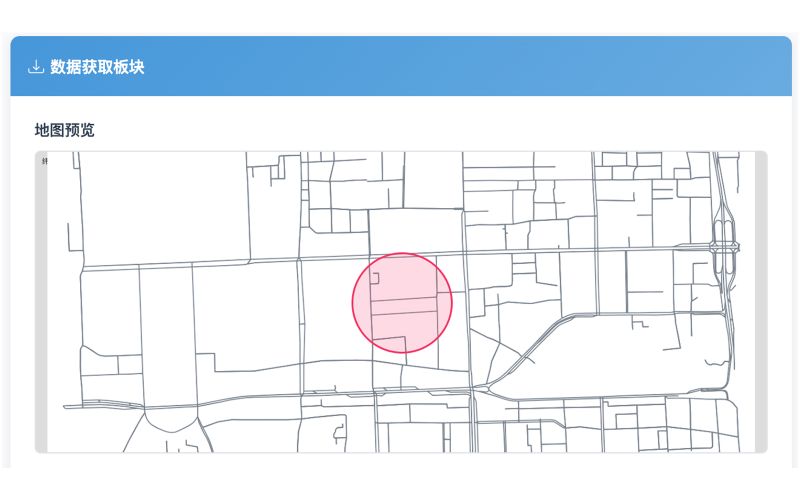
Project Setup
Define study context, assign coordinate projection, and initialize metadata cache.
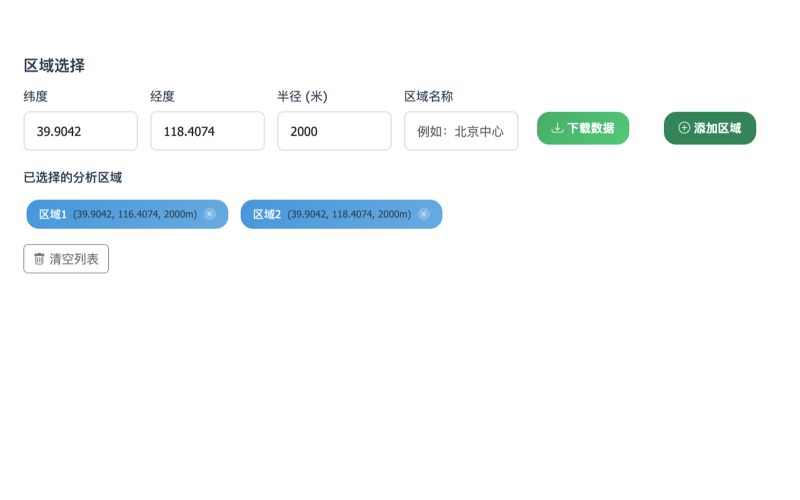
Network Data
Ingest Overpass geometries, clean topological dead-ends, and build primal graph.
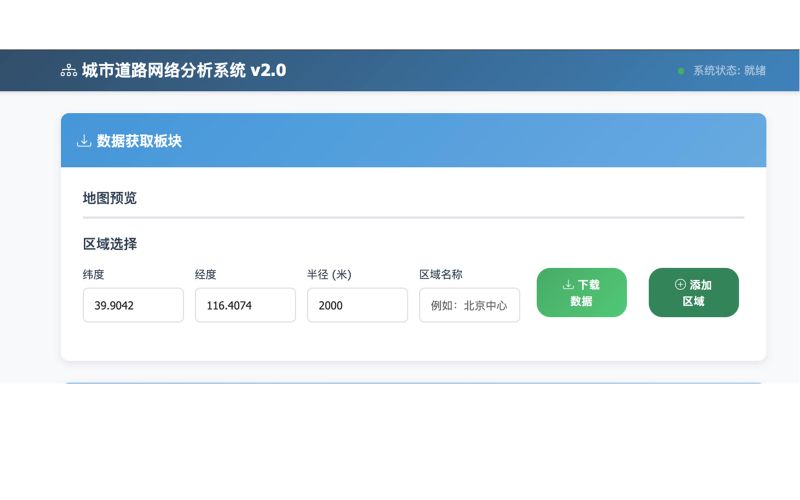
Topology Analysis
Calculate node degree, link circuity, clustering coefficients, and alpha/beta connectivity.
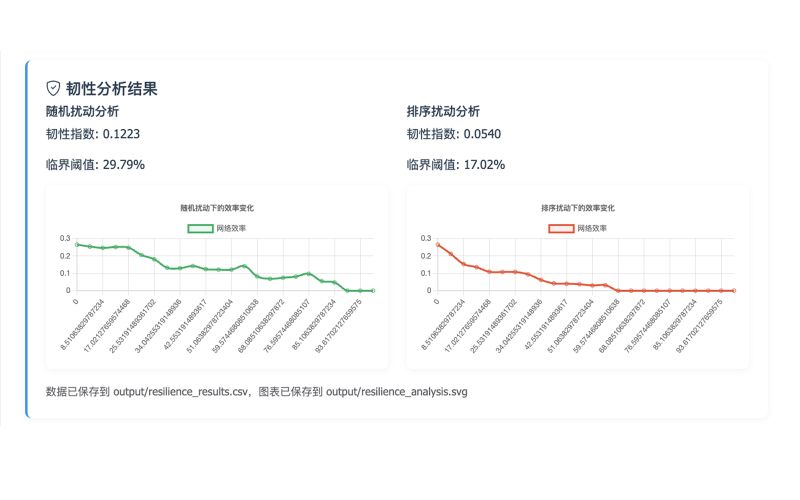
Centrality Analysis
Compute multi-order betweenness, closeness, and eigenvector distribution.
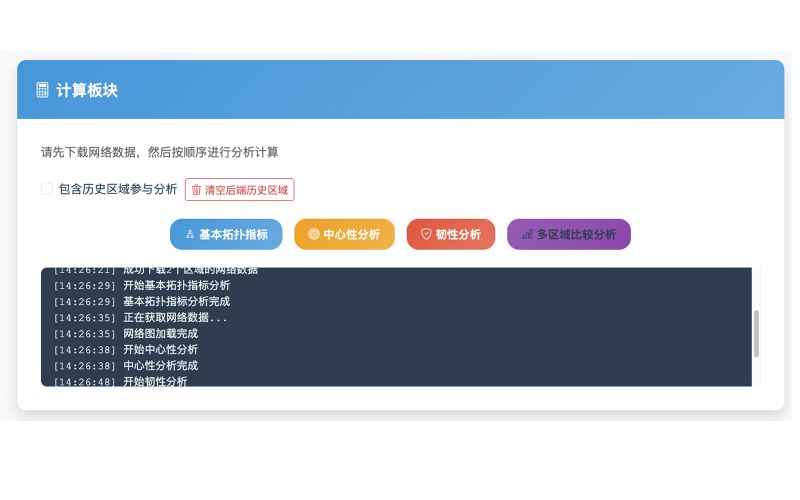
Resilience Assessment
Simulate targeted node attack, random link failures, and giant component percolation.
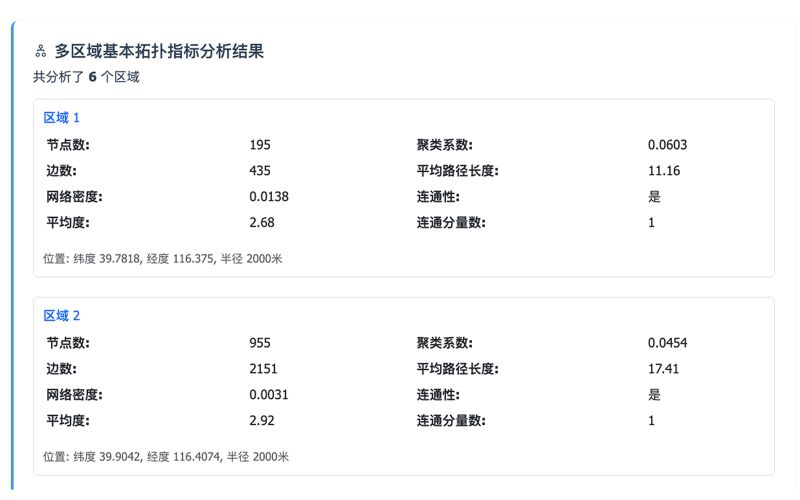
Area Comparison
Align normalized spatial baselines and generate side-by-side indicator delta bars.
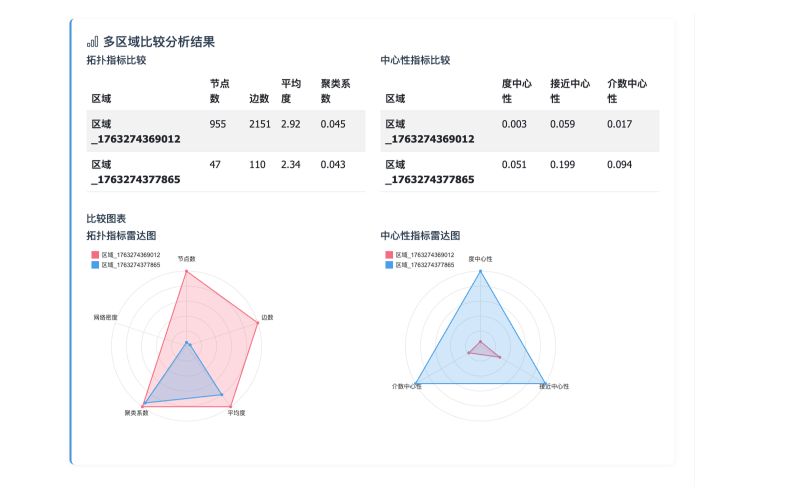
Visualization
Interactive thematic heatmaps, custom choropleths, and topological radar charting.
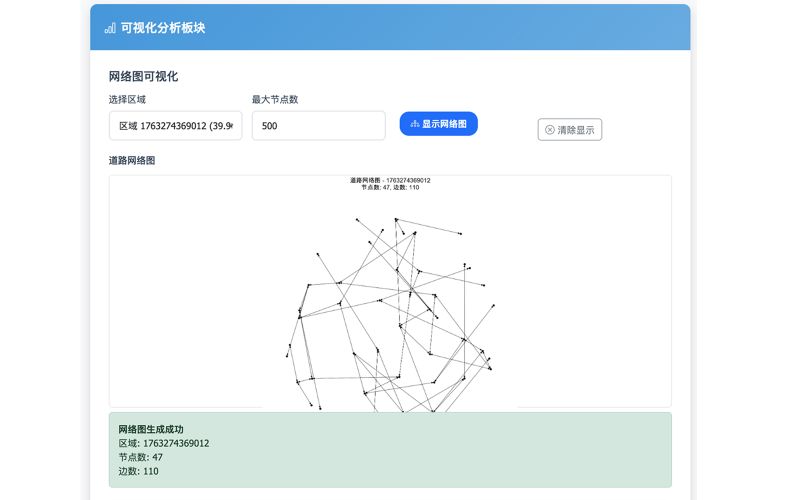
Export & Deliver
Package academic vector figures (SVG/PDF), GeoJSON layers, and analytical summary CSVs.
A system architecture built for heavy computation and low UI latency.
The product bridges high-performance spatial algorithms in Python with a fluid, lightweight browser canvas. Decoupled execution guarantees that heavy matrix inversions never freeze interface interactions.
Graph algorithms run inside detached Celery worker processes. WebSocket streams return incremental calculation progress every 250ms.
Bounding polygons and parameter sets generate SHA-256 state hashes. Re-evaluating previously calculated zones renders in under 12ms.
Graph primitives render via an offscreen HTML5 Canvas context, handling 50,000+ nodes and edges without browser thread degradation.
Product Deliverables & Milestones
Concrete outcomes achieved through systematic software execution and academic verification.
Registered Software IP
Officially granted Computer Software Copyright by the National Copyright Administration, confirming original architecture, UI workflows, and computational pipelines.
End-to-End Cycle
Standardized topological evaluation from raw OpenStreetMap bounding box ingestion to publication-ready vector figures from several hours of ad-hoc scripting down to minutes.
Benchmarking Matrix
Native comparative module enables concurrent evaluation of up to 5 urban metropolitan zones with normalized indicator deltas and synchronized percolation curves.
Reflection & What's Next
Translating computational scripts into a coherent design tool taught us that product discipline does not mean hiding algorithmic complexity - it means orchestrating it with purpose.
Test terminology and result interpretation across differing tiers of user expertise - from pure academic graph theorists to municipal municipal transit operators.
Further separate primary spatial indicators from advanced algorithmic tuning drawers to provide zero cognitive distraction for rapid evaluations.
Improve user-facing visibility around OpenStreetMap data hygiene, topological assumptions, and boundary truncation effects in dense urban areas.
Build specialized export presets formatted directly for peer-reviewed paper layouts, conference slide decks, and live classroom teaching demonstrations.
Investment & Operations Model
A scenario-based financial simulation and decision support tool for urban asset development, operating cashflows, and socioeconomic impact forecasting.